Equilibrium Graphs
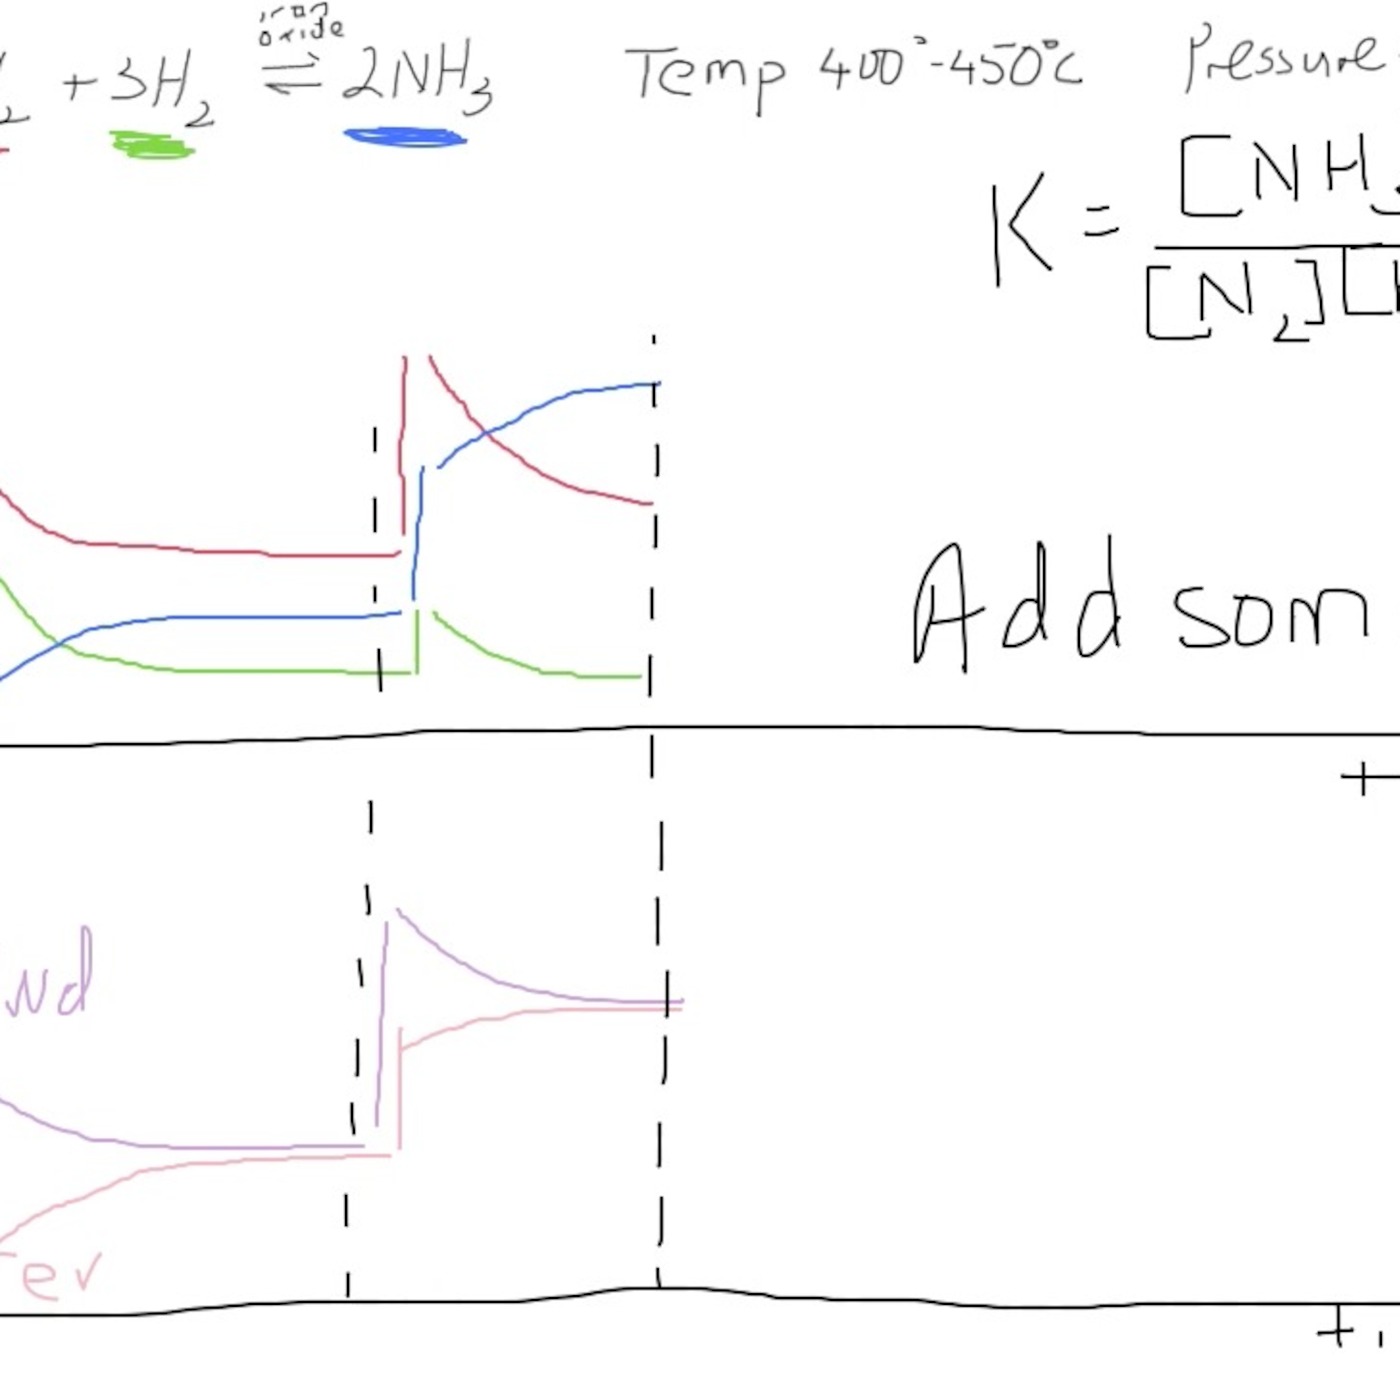
b'We look at graphs of concentration vs time and rate vs time for the Haber process. Consideration of the value of the equilibrium constant as changes are made to the system at equilibrium are included.'