This Week in Economics 26 September 2015
This Week in Economics is real time forecasting and analysis of the previous week's economic activities.The longest running programme of its type on Internet Radio and the Bostonred Network(bostonred.org)
Esta semana en la econom\xeda es la predicci\xf3n en tiempo real y an\xe1lisis de actividades.El econ\xf3mica de la semana anterior programa de m\xe1s larga duraci\xf3n de su tipo en la radio por Internet y la red Bostonred Network.
Diese Woche in Economics ist Echtzeit-Prognose und Analyse der vergangenen Woche die wirtschaftliche activities.The l\xe4ngsten laufende Programm seiner Art auf Internetradio und dem Bostonred Network (bostonred.org)
The Estimated Inflation Model and Inflation Decomposition Procedure
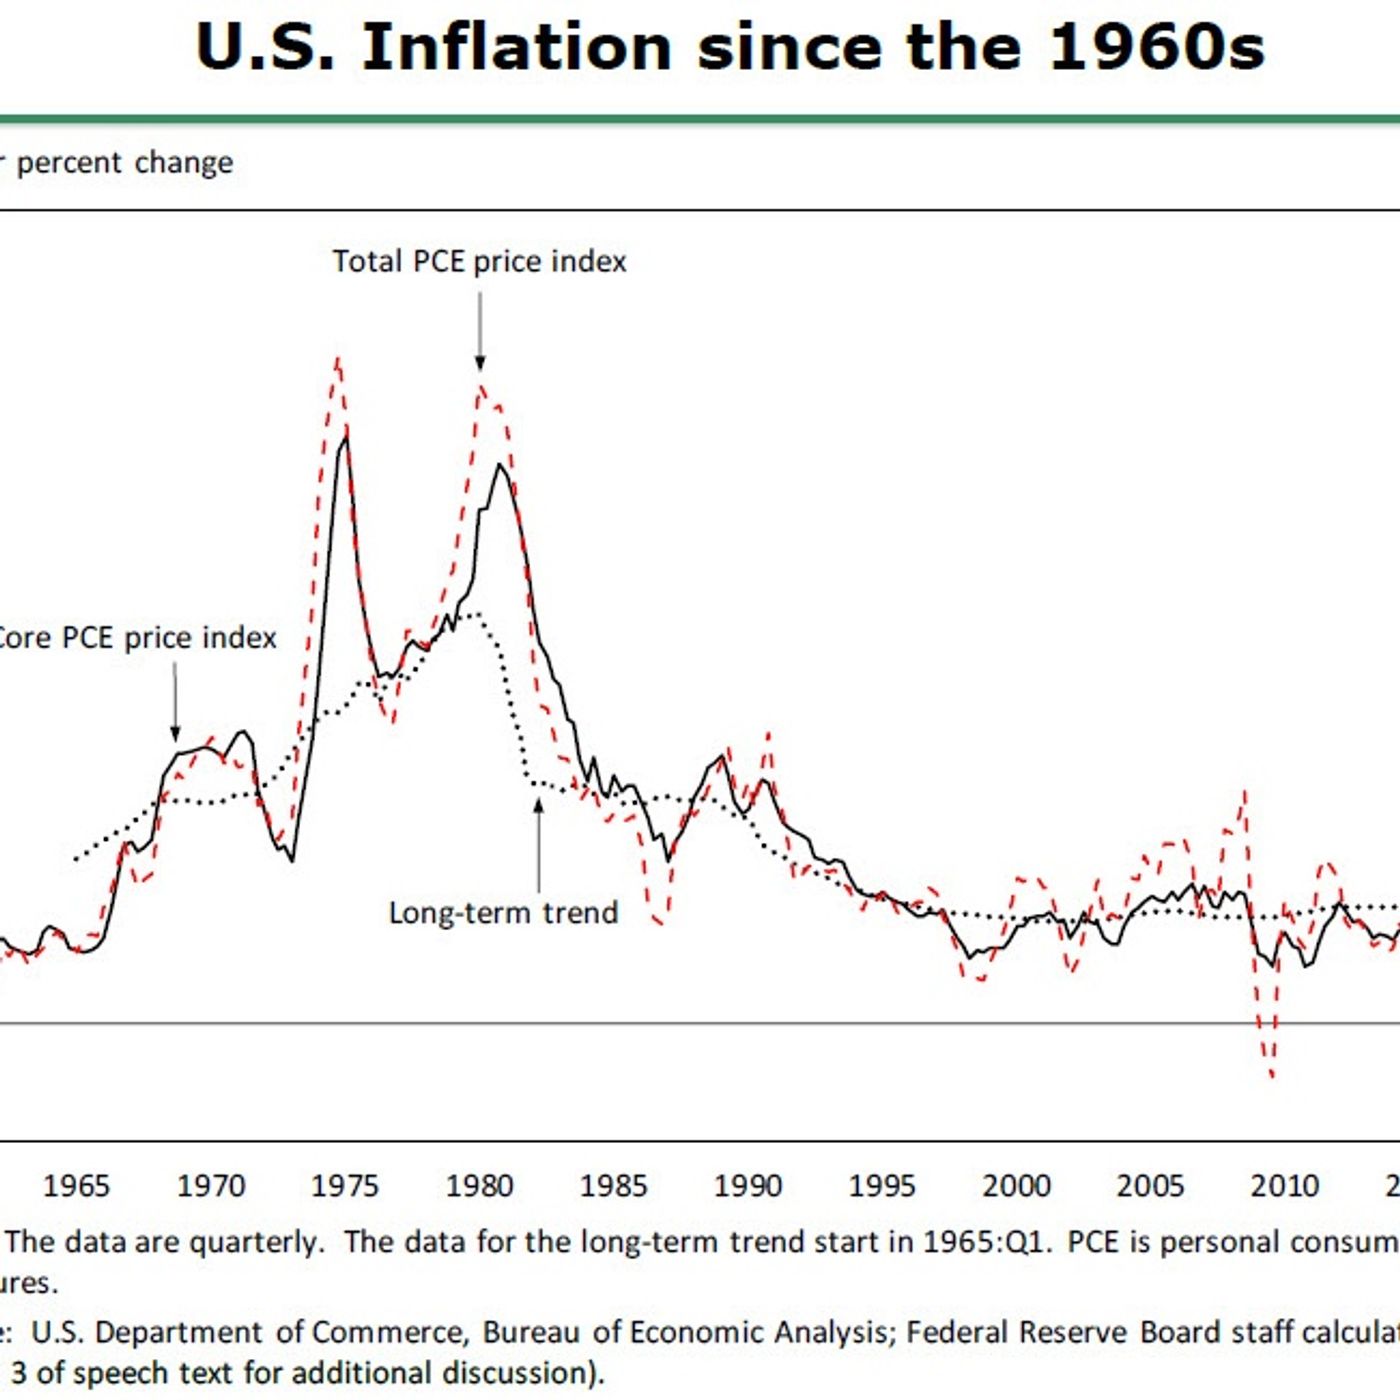
The inflation model used in the decomposition procedure includes two equations--an identity for the change in the price index for total personal consumption expenditures (PCE) and a simple reduced-form forecasting equation for core PCE inflation. The identity is \\pi_t= \\pi_t^c+\\omega_t^e \\mathit{RPIE}_t+\\omega_t^f \\mathit{RPIF}_t,
where \\pi_t and \\pi_t^c denote growth rates (expressed as annualized log differences) of total and core PCE prices, respectively; \\mathit{RPIE}_t and \\mathit{RPIF}_t are annualized growth rates for prices of consumer energy goods and services and prices of food and beverages, both expressed relative to core PCE prices; and \\omega_t^e and \\omega_t^f are the weights of energy and food in total consumption. The core inflation forecasting equation is
\\pi_t^c= \\mathrm{.41} \\pi_t^e + \\mathrm{.36} \\pi_{t-1}^c+ \\mathrm{.23} \\pi_{t-2}^c - \\mathrm{.08} \\mathit{SLACK}_t+\\mathrm{.57} \\mathit{RPIM}_t+\\epsilon_t,
where \\pi_t^e is expected long-run inflation; \\mathit{SLACK}_t denotes the level of resource utilization; \\mathit{RPIM}_t controls for the effect of changes in the relative price of core imported goods; \\epsilon_t is a white-noise error term; and the coefficients are ordinary least squares estimates obtained using data from 1990:Q1 to 2014:Q4.
For estimation purposes, \\mathit{SLACK}_t is approximated using the unemployment rate less the Congressional Budget Office's (CBO) historical series for the long-run natural rate,